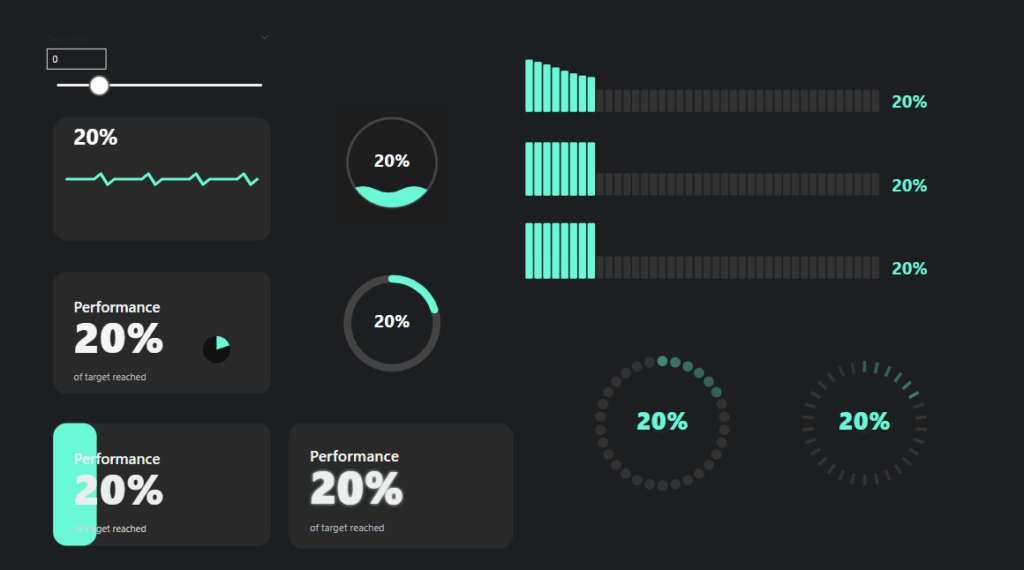
HTML, CSS and SVGs are some of the things I know relatively well, Ive always messed around making games, animating or building apps out of various methods. In this case I wanted to understand how I can use SVG, HTML & CSS to enhance PowerBI reports.
PowerBI whilst it has a lot of options in terms of its custom visuals, that same flexibility isnt always there. Difference is now you can use SVGs & HTML in tables, cards and all sorts just the same as if you were coding in a webpage. A lot of amazing content creators have already covered a lot of use cases for using HTML & SVG in things like tables. I wanted to do something a bit different, taking a look at those more traditional HTML methods I know for adding things like animation.
What I have built out as part of this blog post can then be used as a base for building out pretty much anything when it comes to using SVGs and HTML. Throw in animation, changing colors anything you can think of.
I love that these things also feed into my role as a Product Manager. I can dabble, play and find new ways to make UI / UX more exciting and engaging for my customers.
Setting up the SVG / HTML Measure
Firstly, for these initial cases I am just using the built in PowerBI visuals. To make this work we have to load the SVG / HTML in via a measure.
I have created two base measures to cover common scenarios, depending on your needs (note we can not use JavaScript in either with PowerBI)
- Using <foreignObject> to embed extended HTML and CSS inside SVG
- Using pure SVG native elements
| Feature | SVG Native | <foreignObject> (Extended HTML inside SVG) |
|---|---|---|
| CSS Support | Limited to SVG and subset of CSS | Full CSS including advanced layout, pseudo-elements |
| Browser & tool support | Very broad, stable | Good in modern browsers, less consistent in tools like Power BI |
| Use cases | Simple vector graphics, text, shapes | Complex layouts, rich text formatting inside SVG |
| Performance | Lightweight, fast | Slightly heavier, potentially slower |
| Interactivity | SVG events and styling only | Can use HTML events and richer interaction |
<foreignObject> Base
HTMLBASE_FO =

-- Get the percentage value from a slicer or parameter table (assumes 0 to 1 scale)
VAR pct = Parameter1[Parameter Value]

-- Format the percentage as a whole number string with a "%" sign (e.g., "85%")
VAR pctText = FORMAT(pct * 100, "0") & "%"

-- Define the size of the SVG image
VAR sizeWidth = 320
VAR sizeHeight = 180

-- Define dynamic colours
VAR baseColor = "#292929"
VAR textColor = "#f5f5f5"
VAR subtitleColor = "#bbb"

-- Build the HTML block for the foreignObject
VAR svghtml = "
<foreignObject x='0' y='0' width='" & sizeWidth & "' height='" & sizeHeight & "'>
  <div xmlns='http://www.w3.org/1999/xhtml'>
    <style>
      .card {
        width: 100%;
        height: 100%;
        background-color: " & baseColor & ";
        border-radius: 20px;
        padding: 24px;
        box-sizing: border-box;
        font-family: Segoe UI, sans-serif;
        display: flex;
        flex-direction: column;
        justify-content: center;
      }
      .title {
        font-size: 22px;
        font-weight: 600;
        color: " & textColor & ";
      }
      .value {
        font-size: 64px;
        font-weight: 900;
        color: " & textColor & ";
        margin-top: 4px;
      }
      .subtitle {
        font-size: 14px;
        color: " & subtitleColor & ";
        margin-top: auto;
      }
    </style>
    <div class='card'>
      <div class='title'>Title</div>
      <div class='value'>" & pctText & "</div>
      <div class='subtitle'>SubTitle</div>
    </div>
  </div>
</foreignObject>
"

-- Wrap the foreignObject in an SVG
VAR svg = "<svg xmlns='http://www.w3.org/2000/svg' width='" & sizeWidth & "' height='" & sizeHeight & "'>" & svghtml & "</svg>"

-- Return the inline image
RETURN "data:image/svg+xml;utf8," & svg
SVG Native Base
HTMLBASE_SVG =
VAR pct = Parameter1[Parameter Value]
VAR pctText = FORMAT(pct * 100, "0") & "%"
VAR sizeWidth = 320
VAR sizeHeight = 180

VAR baseColor = "#292929"
VAR textColor = "#f5f5f5"
VAR subtitleColor = "#bbb"

VAR fillColor =
    SWITCH(
        TRUE(),
        pct < 0.2, "#E59EFB",
        pct > 0.8, "#F8FAB7",
        "#6bfad8"
    )


-- SVG generation
VAR svg = "
<svg xmlns='http://www.w3.org/2000/svg' width='" & sizeWidth & "' height='" & sizeHeight & "' viewBox='0 0 " & sizeWidth & " " & sizeHeight & "'>
  <style>
    .card-base {
      fill: " & baseColor & ";
    }
    .title {
      font-family: Segoe UI, sans-serif;
      font-size: 22px;
      font-weight: 600;
      fill: " & textColor & ";
    }
    .value {
      font-family: Segoe UI, sans-serif;
      font-size: 64px;
      font-weight: 900;
      fill: " & textColor & ";
    }
    .subtitle {
      font-family: Segoe UI, sans-serif;
      font-size: 14px;
      fill: " & subtitleColor & ";
    }
  </style>

  <!-- Background -->
  <rect class='card-base' width='" & sizeWidth & "' height='" & sizeHeight & "' rx='20' ry='20'/>

  <!-- Text -->
  <text x='30' y='60' class='title'>Title</text>
  <text x='30' y='120' class='value'>" & pctText & "</text>
  <text x='30' y='160' class='subtitle'>SubTitle</text>

</svg>
"

RETURN "data:image/svg+xml;utf8," & svg
Adding the SVG / HTML Measure into a Card
Next, to use this measure I have been using it in the new card visual. Drop a card onto your dashboard – for the case of this code you will need to put any value into the Data field and then disable the callout value / label.
Once added open the “Images” section on the card settings. Change the Image type to “Image URL” and select your new measure.

Modifying for your own use case
Once you have this in place you should end up with something like this

Now you change them around, build anything as long you keep the main building blocks of the code for SVG rendering.
Eventually you can end up with all sorts of cool things such as the below. These are then all animated with various methods.

A further example
This code for example animated the bar in the top right with a wave effect
HTML_Wave_Bar =

VAR pct = Parameter1[Parameter Value]
VAR pctText = FORMAT(pct * 100, "0") & "%"

VAR numBars = 40                        -- Added: number of bars for progress
VAR barsToFill = ROUND(pct * numBars, 0)   -- Added: how many bars to fill based on pct


VAR fillColor =                          -- Added: conditional bar color based on pct
    SWITCH(
        TRUE(),
        pct < 0.2, "#E59EFB",
        pct > 0.8, "#F8FAB7",
        "#6bfad8"
    )

-- Added: Generate multiple bar divs with animation and staggered delay
VAR barHTML =
CONCATENATEX (
    GENERATESERIES(1, numBars, 1),
    VAR i = [Value]
    VAR isFilled = i <= barsToFill
    VAR barColor = IF(isFilled, fillColor, "#333")
    VAR height = IF(isFilled, "100%", "40%")
    VAR animation = IF(isFilled, "waveBar 2.5s ease-in-out infinite", "none")
    VAR delay = FORMAT((i - 1) * 0.10, "0.00") & "s"
    VAR animationDelay = IF(isFilled, delay, "0s")
    RETURN "
        <div class='bar' style='
            background: " & barColor & ";
            height: " & height & ";
            animation: " & animation & ";
            animation-delay: " & animationDelay & ";
        '></div>"
)

-- Dimensions increased for full bar display (added larger SVG size)
VAR sizeWidth = 1280
VAR sizeHeight = 200

-- Added: Style definitions including animation keyframes for bars and fade-in for label
VAR svghtml = "
<foreignObject x='0' y='0' width='" & sizeWidth & "' height='" & sizeHeight & "'>
<div xmlns='http://www.w3.org/1999/xhtml'>
  <style>
    .container {
      font-family: Segoe UI, sans-serif;
      width: 90%;
      height: 150px;
      margin: auto;
      display: flex;
      align-items: flex-end;
      justify-content: flex-start;
      gap: 4px;
    }
    .bar {
      width: 20px;
      border-radius: 4px;
      transition: height 0.3s ease;
    }
    .percentage-label {
      font-size: 48px;
      font-weight: bold;
      color: " & fillColor & ";
      text-shadow: 0 0 6px rgba(0,0,0,0.3);
      margin-left: 30px;
      align-self: flex-end;
      animation: fadeIn 0.5s ease-in;
    }
    @keyframes waveBar {
      0%, 100% { height: 60%; }
      50% { height: 100%; }
    }
    @keyframes fadeIn {
      from { opacity: 0; transform: translateX(-10px); }
      to { opacity: 1; transform: translateX(0); }
    }
  </style>
  <div class='container'>
    " & barHTML & "
    <div class='percentage-label'>" & pctText & "</div>
  </div>
</div>
</foreignObject>
"

-- Wrap in SVG and return as image (same concept, but bigger canvas for wave bars)
VAR svg = "<svg xmlns='http://www.w3.org/2000/svg' width='" & sizeWidth & "' height='" & sizeHeight & "'>" & svghtml & "</svg>"

RETURN "data:image/svg+xml;utf8," & svg
Aether Repository – Use SVG, HTML & CSS to enhance PowerBI reports
I have added these base sets of code to my Aether repo. So feel free to grab, comment and play. As I create some new animations and visuals, I will look to upload those as well
