Thanks for bearing with me! First blog post of 2026, lets just say I have been busy! To start us off, I have another PowerShell script I put together the end of last year, a way to search for PowerBI parameters with PowerShell.
When running:
multiple workspaces
with multiple reports
all with multiple parameters
Sometimes, it seems you need an easy solution to find where you have set parameters to specific items.
My use case for example, I have a number of reports pointing to a specific data source. When migrating that data source I wanted to discover which reports where still attached so this script made it super simple!
How it works?
This PowerShell script, similar to a few of my others will loop through all the PowerBI workspaces you have access to, and at the same time loop through every report and parameter, logging where it finds the defined parameter as it goes.
The parameters endpoint for every dataset makes it simple to find this information and we can simply loop through each. It will naturally log results in a custom object showing the:
Workspace Name
Report Name
Parameter Name
Current Parameter Value
Dataset ID
What do you need to modify?
This is one is a real simple one, just change the searchValue to the actual value of the parameter itself you want to discover, for example
Parameter Name : Source
Parameter Value : SQLDB1
So in this case we search for SQLDB1
So hopefully this will help you! It certainly saved a huge amount of time for me! code below!
Connect-PowerBIServiceAccount

# The value you are searching for
$SearchValue = "Domain"

$workspaces = Get-PowerBIWorkspace -All

Write-Host "Starting Scan" -ForegroundColor Yellow


$Results = $workspaces | ForEach-Object -Parallel {
    $Target = $using:SearchValue
    $workspace = $_

    try {
        # Get reports in this workspace
        $Reportlist = Get-PowerBIReport -WorkspaceId $workspace.Id

        foreach ($Report in $Reportlist) {
            if (-not $Report.DatasetId) { continue }

            # Fetch parameters for the dataset
            $Url = "https://api.powerbi.com/v1.0/myorg/groups/$($workspace.Id)/datasets/$($Report.DatasetId)/parameters"
            $resp = Invoke-PowerBIRestMethod -Url $Url -Method Get
            $params = (ConvertFrom-Json $resp).value

            foreach ($p in $params) {
                if ($p.currentValue -eq $Target) {

                    Write-Host "[MATCH] Workspace: $($workspace.Name)" -ForegroundColor Cyan
                    Write-Host "        Report:    $($Report.Name)" -ForegroundColor White
                    Write-Host "        Parameter: $($p.name)" -ForegroundColor Green


                    # Collect in Object
                    [PSCustomObject]@{
                        Workspace     = $workspace.Name
                        Report        = $Report.Name
                        ParameterName = $p.name
                        ParameterValue = $p.currentValue
                        DatasetId     = $Report.DatasetId
                    }
                }
            }
        }
    } catch {
        # Skip datasets that cannot be accessed
    }
} -ThrottleLimit 8

if ($Results) {
    $Results | Out-GridView -Title "Search Results: Parameter Value '$SearchValue'"
} else {
    Write-Host "No reports found with parameter value: $SearchValue" -ForegroundColor Red
}
When you use scheduled refresh in the Power BI service, it pauses if nobody accesses the report or dataset for 60 days. That’s fine from a load perspective, but if you want your datasets to always have the latest data and be available on demand, you’ll need to stop that from happening.
Now there are some manual approaches such as creating a Subscription on each dataset within the service UI, but if we are putting our reports out at scale that just isn’t viable. So what we can do is build a PowerShell script that will loop through each of our datasets and prevent scheduled refresh from being disabled due to inactivity.
The best way to achieve this is to trigger activity on the dataset. I do this by querying a table and column I know exist and discarding the result.
For the full script, scroll down, but I’ll cover what it does and what bits you can change.
Configuration
When building the script, permissions can make it harder to directly access certain tables with PowerShell. If we know the exact name of the tables to try and a column within them then we access it directly.
Firstly within this part of the code, choose a table within your dataset. When I was building I was checking for a couple of tables that had the same column name.
#Select which tables exist in the datasets
$tablesToTry = @(
    "######",
    "######"
)
Next, pick a column to query. I used [id] in my example.
#Column to try within the tables
$columnSuffix = "####"
Lastly I had certain named datasets I wanted to query and some I wanted to exclude so that can be covered in this part of the code
#Dataset names to include or exclude - blank returns all, separate with | for multiple
$include = ""
$exclude = ""
How the script works
Connect to Power BI
The script starts by connecting to your Power BI account using:
Connect-PowerBIServiceAccount
If the connection fails, it stops and logs a warning. Once connected, the script can access all workspaces and datasets your account has permission to see.
Gather Workspaces and Datasets
It retrieves all your workspaces using:
Get-PowerBIWorkspace -All
Then, for each workspace, it lists all datasets. You can filter which datasets to include or exclude with simple patterns. For example:
$include = "Sales|Finance"
$exclude = "Test"
Test Tables and Columns
For each dataset, the script loops through a list of tables you specify:
It builds a DAX query for each table/column combination, using TOPN to return a small sample. This keeps the load low while confirming the table exists and is accessible.
Example query generated for the “Orders” table:
EVALUATE
TOPN(10, 'Orders', 'Orders'[id], DESC)
Execute Queries via REST API
The script runs the queries using the Power BI REST API:
Invoke-PowerBIRestMethod -Url "datasets/$($dataset.Id)/executeQueries" -Method Post
If the query succeeds, it logs the dataset and table in $successfulDatasets and prints the rows.
If it fails, it captures the error and logs it in $failedDatasets for troubleshooting later.
Trigger Report Usage
For each dataset, the script looks for reports linked to it:
If a report is linked, the script exports it to PDF and discards the file. The export counts as usage and keeps the dataset active.
Invoke-PowerBIRestMethod -Url "reports/$($report.Id)/ExportTo" -Method Post -Body (@{ format = "PDF" } | ConvertTo-Json)
Logging and Results
At the end, the script prints three tables:
✅ Successfully queried datasets
❌ Datasets that failed
📊 Datasets where usage was triggered
The Script
# ============================
# POWERBI Trigger Usage
# James Mounsey-Moran
# ============================


# ============================
# CONFIGURATION
# ============================


#Select which tables exist in the datasets
$tablesToTry = @(
    "######",
    "######"
)


#Column to try within the tables
$columnSuffix = "####"

#Dataset names to include or exclude - blank returns all, separate with | for multiple
$include = ""
$exclude = ""


# ============================

$daxQueryTemplate = @"
EVALUATE
TOPN(10, {0}, {1}, DESC)
"@

$failedDatasets     = @()
$successfulDatasets = @()
$usageTriggered     = @()

# ============================
# CONNECT TO POWER BI SERVICE
# ============================
try {
    Connect-PowerBIServiceAccount -ErrorAction Stop
}
catch {
    Write-Warning "Failed to connect to Power BI Service: $($_.Exception.Message)"
    return
}

# ============================
# GET ALL WORKSPACES
# ============================
try {
    $workspaces = Get-PowerBIWorkspace -All -ErrorAction Stop
}
catch {
    Write-Warning "Failed to retrieve workspaces: $($_.Exception.Message)"
    return
}

foreach ($workspace in $workspaces) {
    Write-Output "`nProcessing workspace: $($workspace.Name) ($($workspace.Id))"

    try {
          $datasets = Get-PowerBIDataset -WorkspaceId $workspace.Id -ErrorAction Stop |
    Where-Object {
        (-not $include -or $_.Name -match "(?i)$include") -and
        (-not $exclude -or $_.Name -notmatch "(?i)$exclude")
    }
    }
    catch {
        Write-Warning "Failed to list datasets in workspace $($workspace.Name): $($_.Exception.Message)"
        continue
    }

    if ($datasets.Count -eq 0) {
        Write-Output "  No  datasets found. Skipping."
        continue
    }

    foreach ($dataset in $datasets) {
        Write-Output "  Processing dataset: $($dataset.Name) ($($dataset.Id))"

        $queriedSuccessfully = $false
        $tableErrors = @()

        foreach ($tableName in $tablesToTry) {
        $quotedTable = "'$tableName'"
        $columnName  = "$quotedTable[$columnSuffix]"
        $daxQuery    = [string]::Format($daxQueryTemplate, $quotedTable, $columnName)

            Write-Output "    Trying DAX: $daxQuery"
            try {
                $response = Invoke-PowerBIRestMethod `
                    -Url "datasets/$($dataset.Id)/executeQueries" `
                    -Method Post `
                    -Body (@{
                        queries = @(@{ query = $daxQuery })
                        serializerSettings = @{ includeNulls = $true }
                    } | ConvertTo-Json -Depth 5) `
                    -ErrorAction Stop

                $json = $response | ConvertFrom-Json
                Write-Output "    ✅ Query successful for table $tableName."
                $json.results[0].tables[0].rows | Format-Table

                $queriedSuccessfully = $true
                $successfulDatasets += [PSCustomObject]@{
                    Workspace = $workspace.Name
                    Dataset   = $dataset.Name
                    DatasetId = $dataset.Id
                    Table     = $tableName
                    Timestamp = Get-Date
                }

                break
            }
            catch {
                $fullMsg = $_.Exception.ToString()
                if ($fullMsg -match '"value":\s*"([^"]+)"') {
                    $errorMessage = $matches[1]
                }
                else {
                    $errorMessage = $_.Exception.Message
                }

                Write-Warning "    ❌ Failed for table $tableName $errorMessage"
                $tableErrors += "Table $tableName $errorMessage"
            }
        }

        if (-not $queriedSuccessfully) {
            Write-Warning "  Could not query dataset $($dataset.Name) with any table."
            $failedDatasets += [PSCustomObject]@{
                Workspace = $workspace.Name
                Dataset   = $dataset.Name
                DatasetId = $dataset.Id
                Error     = ($tableErrors -join "; ")
                Timestamp = Get-Date
            }
        }

        # ============================
        # REGISTER USAGE (EXPORT REPORT)
        # ============================
        try {
            $reports = Get-PowerBIReport -WorkspaceId $workspace.Id | Where-Object { $_.DatasetId -eq $dataset.Id }
            if ($reports.Count -gt 0) {
                $report = $reports[0]  # just pick the first linked report
                Write-Output "    Triggering usage via ExportTo on report: $($report.Name) ($($report.Id))"

                $null = Invoke-PowerBIRestMethod `
                    -Url "reports/$($report.Id)/ExportTo" `
                    -Method Post `
                    -Body (@{ format = "PDF" } | ConvertTo-Json -Depth 3) `
                    -ErrorAction Stop

                Write-Output "    ✅ Usage registered for dataset $($dataset.Name) via report $($report.Name)."
                $usageTriggered += [PSCustomObject]@{
                    Workspace = $workspace.Name
                    Dataset   = $dataset.Name
                    Report    = $report.Name
                    Timestamp = Get-Date
                }
            }
            else {
                Write-Warning "    ⚠️ No report found linked to dataset $($dataset.Name). Cannot register usage."
            }
        }
        catch {
            Write-Warning "    ❌ Failed to trigger usage for dataset $($dataset.Name): $($_.Exception.Message)"
        }
    }
}

# ============================
# REPORT SUCCESSFUL DATASETS
# ============================
if ($successfulDatasets.Count -gt 0) {
    Write-Output "`n✅ Successfully queried datasets:"
    $successfulDatasets | Format-Table -AutoSize
}

# ============================
# REPORT FAILED DATASETS
# ============================
if ($failedDatasets.Count -gt 0) {
    Write-Output "`n❌ Datasets failed to query:"
    $failedDatasets | Format-Table -AutoSize
}

# ============================
# REPORT USAGE REGISTRATION
# ============================
if ($usageTriggered.Count -gt 0) {
    Write-Output "`n📊 Usage registered for datasets:"
    $usageTriggered | Format-Table -AutoSize
}
else {
    Write-Output "`n⚠️ No usage registrations were made."
}
Once this is running, you won’t need to worry about refresh being paused after 60 days. The script keeps everything ticking over by simulating activity, so your datasets stay active and ready whenever you need them.
Creating Animated Line Charts in Power BI can be done in several ways. The most common approaches are using SVGs with measures and cards, or leveraging 3rd-party custom visuals that render HTML. While SVGs combined with a card look visually impressive, they often lose some of the interactivity we expect from native visuals such as tooltips.
To solve this, we can combine native visuals with SVGs, layering them together to create animated line charts that retain interactivity.
For this method, we’ll use:
A line chart supported by measures that provide the line itself plus space above and below it.
An animated SVG background placed behind the chart.
Step 1: Create the measures
For this example, we’ll use a dataset that tracks costs over time. We need three measures to build our animated line chart
Measure 1 (The actual cost)
This initial measure will simply be the actual value, so the cost column. In this instance I have just loaded into a measure called [COST]
COST = SUM(ProductSales[Cost])
Measure 2 (The Line)
To create the line we want to highlight, we need it to sit just above the actual cost. We do this by creating a new measure that takes the cost for each date and returns 4% of it, making a thin but visible line on the chart.
The final measure fills the remaining space on the Y axis. This makes the chart look full while leaving about 30% of space above the line. We implement this measure as follows
With the measures in place, we can start building the visual. The steps below show how to use the measures to create the chart.
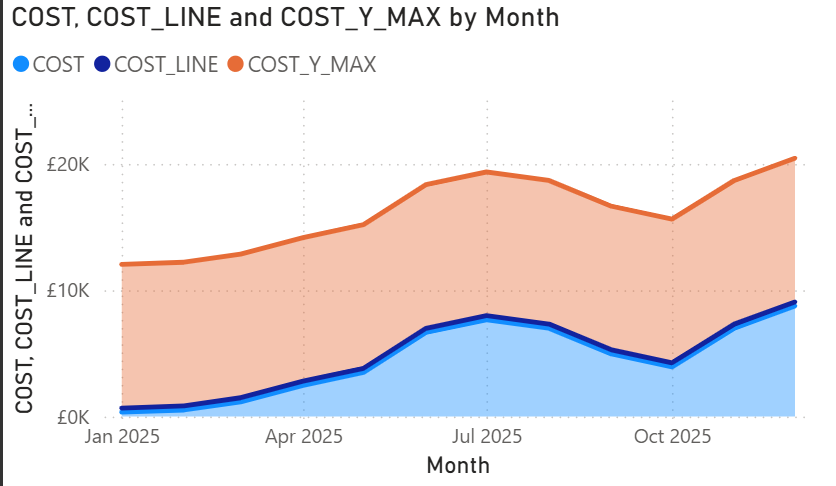
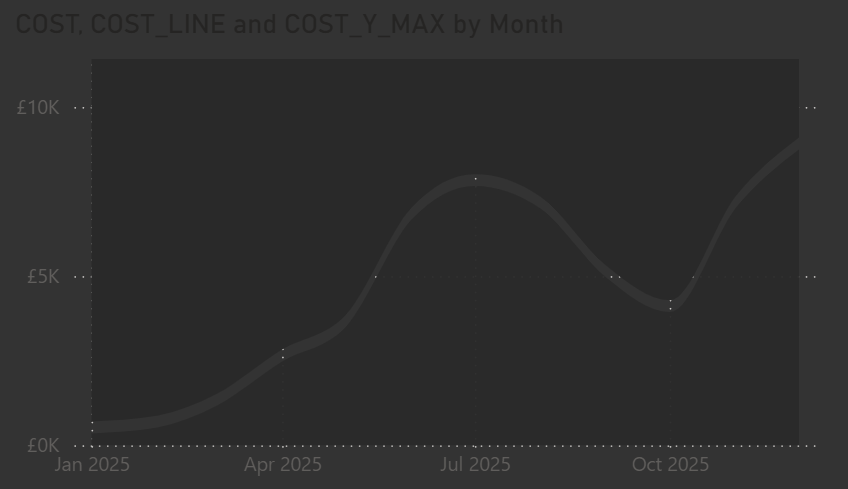
Add a Stacked Area Chart
On the Y axis, add the three measures in this order: COST, COST_LINE, COST_Y_MAX
On the X axis add a Date column from your dataset
Once added, your chart should look something like the example below.
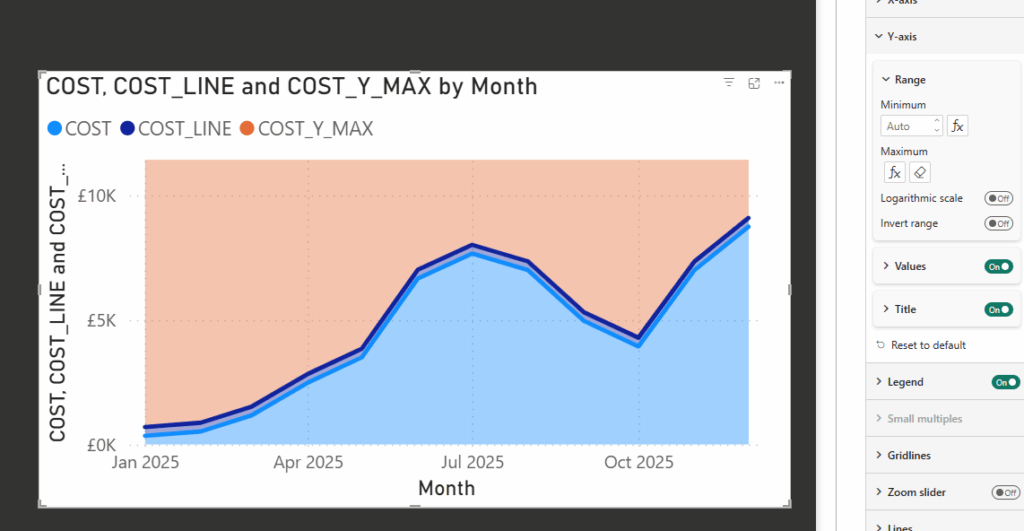
Next, we need the COST_Y_MAX measure to fill the top part of the chart. To do this:
Select the visual and go to Y Axis, Range.
Set the maximum value to COST_Y_MAX.
This ensures the chart fills the Y axis correctly and leaves space above the line.
Step 3: Format the chart layers
Now that we have the basic chart, it’s time to set up the visual elements that will support the layers behind it.
Select the visual and disable the legend.
Under X & Y Axis, disable the titles (optional if you don’t need them).
Under General, Background, choose a background color. In this example, I’ve used #292929. Make a note of this, as we’ll be turning the background off later.
After these changes, your visual should look something like this:
Next we need to use that same background for our shade areas and lines
Under Lines
Select the COST_Y_MAX Series and untick show for this series
Select the COST Series and untick show for this series as well
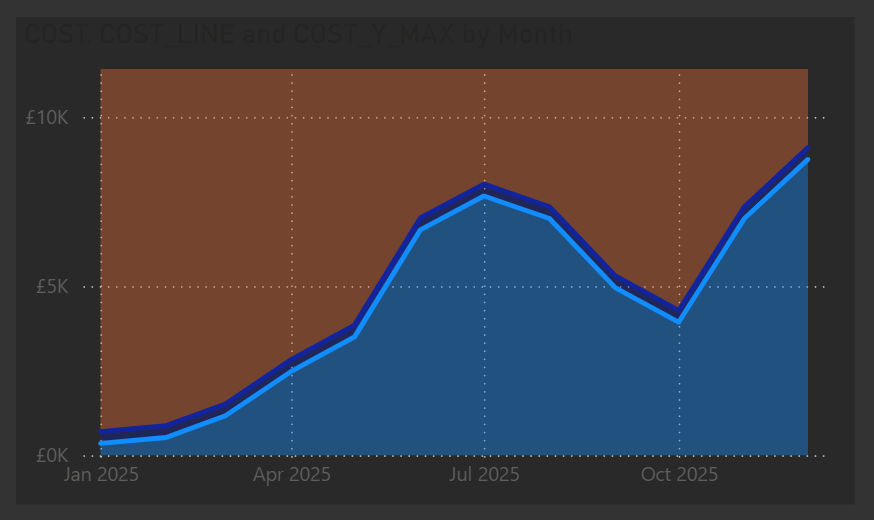
Under Shade Area
Select the COST_Y_MAX Series, untick match line color
Set the Color to the same as your background color (e.g. #292929) and set transparency to 0%
Select the COST Series and again untick match line color
Set the Color to the same as your background color (e.g. #292929) but this time set transparency to 5%
Select the COST_LINE Series and uncheck Show for this Series
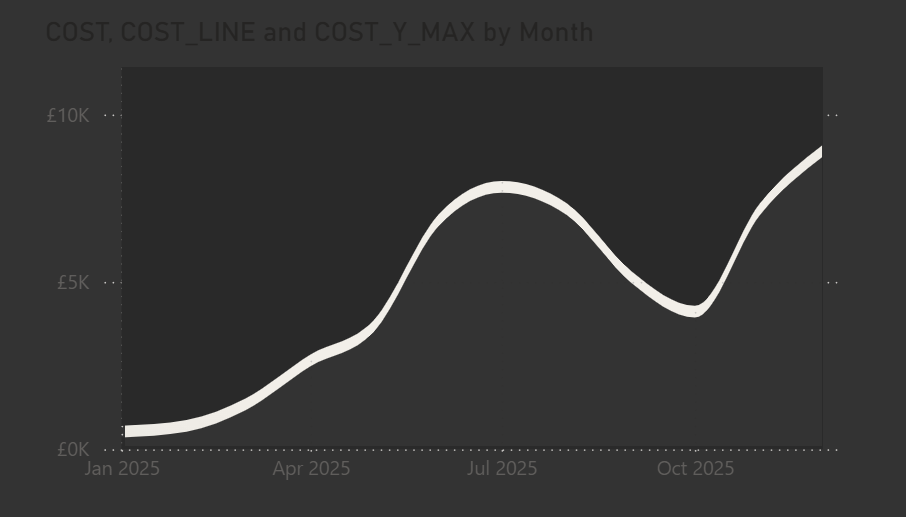
That should now give us the following
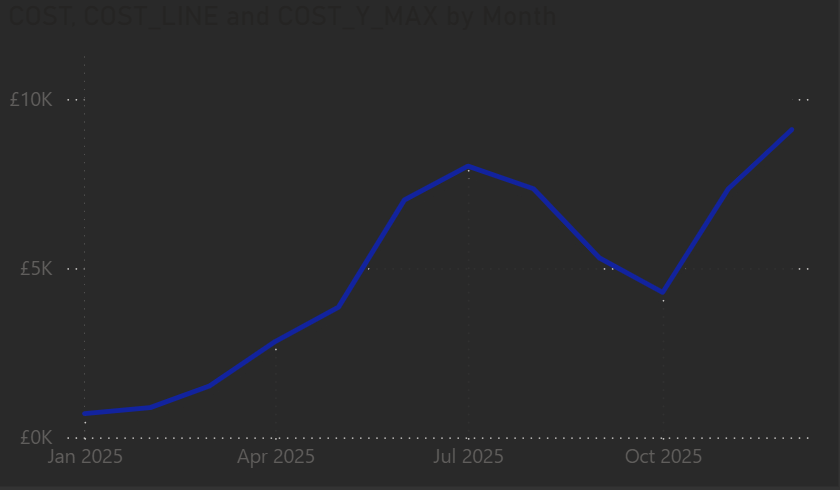
Since we used the other measures to hide parts of the chart, the next step is to fully configure the line area we want to display.
Under Line, with Series All selected, set the Interpolation Type to Smooth and the Smooth type to Monotone.
Under Line, select COST_LINE and uncheck Show for this series.
Finally, go to General, Effects, Background and turn the background off.
This prepares the chart so the animated SVG we’ll add behind it will show correctly.
At this point, our visual is ready for the SVG animation to be added behind it.
For the background, I’ve used the same dynamic SVG setup from a previous post, but applied a different animation in the measure. The steps below show the updated animation code.
Next, we create a measure to generate the animated SVG background. This measure lets us pick different colors or gradients dynamically and animates a rectangle across the visual.
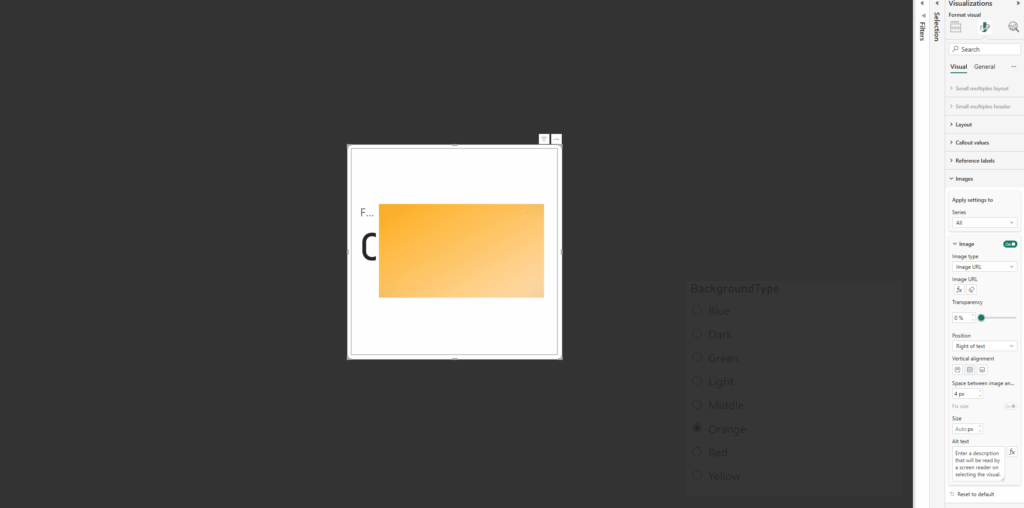
In this step we need to setup the card to be able to apply the measure. As with my other examples I have been using the new card visual.
Firstly, on the card, apply the measure under the image section.
Select Image URL
Select the measure
Add a column / value to the card to the Data parameter (any is fine we are going to remove this from view)
Next we need to resize the card to the full size of the window (or at least the area wanting to use) and then disable the values / labels under the Callout values section:
Disable Values
Disable Label
Now all padding needs to be removed from the card as well as removing all existing backgrounds / style effects
Under Visual / Cards:
Disable Background
Disable Border
Change Padding to custom and set all to 0px
Under Visual / Images
Change Space between Image and callout to 0px
Under General / Effects
Disable Background
Under General / Properties
Set all Padding to 0px
Once added we should now have the two components, the visual we built and the card with the animated background
Step 6: Layer the visuals together
Now for the fun part. We need to place the animated card behind the visual and resize it so it matches the border of the background color we applied to the top and bottom of the chart.
Once positioned correctly, the animation will show through, and you may notice it animate a few times as you adjust the sizing.
Final polish
And that is it. Everything is in place. The visual, the animated background, and the measure controlling it. You can have the animation show a single color, a gradient, or any variation you like. I have tried a few different options myself as you might have seen on my LinkedIn.
Once it was set up, I tidied the visual by adjusting the title and axes, turning off the gridlines, and adding a custom tooltip. Using the built-in tooltips would have shown all the extra measures we added, so the custom tooltip keeps it clean and focused.