What if you could write a DAX query once and run it against every semantic model you have access to, in a single script?
That’s what this post covers. You take a query you already trust, point PowerShell at your workspaces, and get the results back from every model, along with a list of the ones that failed. No clicking through models one at a time.
Why a script?
I’m actively looking at automating DAX queries across multiple workspaces, whether by script, Power Automate or an AI agent. I’ve started with PowerShell, and the reason is the data I work with.
I work with financial data for large companies around the world. That is not where you want a confident, plausible looking number that turns out to be hallucinated.
PowerShell gives me a baseline. I can build up a library of DAX queries that I know return exactly what I need, because I’ve already built and validated them in Power BI. When I move on to agentic AI, that library doesn’t go to waste. It becomes the set of trusted tools an agent can call, rather than something the agent has to invent.
Script first, agent later.
It also has plenty of uses in its own right, and it’s relatively simple to set up.
What you could use it for
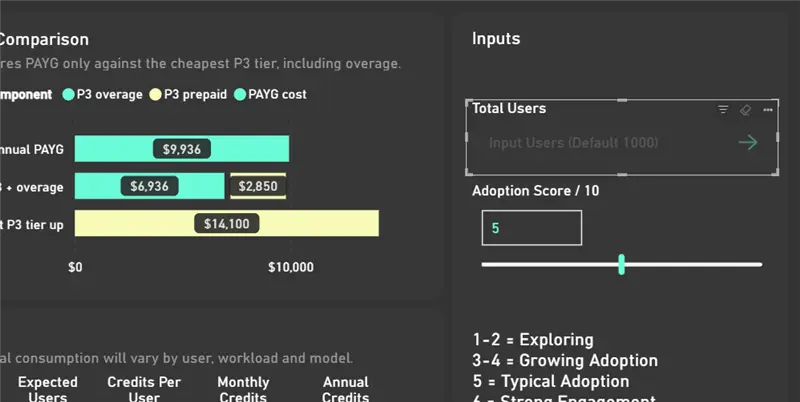
So, here is one use case I’m using it for right now: reviewing Copilot Cowork usage across all my customers.
I’ve already built a visual that combines exactly what I need, so I copy the query behind it and run it against every semantic model. Opening each customer’s report to check by hand would take far too long, and this way the numbers come straight from a visual I already trust.
Quick and easy, and reducing that hallucination risk as I build out further with data agents.
Step 1: Grab a DAX query from Power BI Desktop
If you’ve read my post on running DAX queries from Power Automate
How to Connect Power BI to Power Automate: Running DAX Queries | JamesMM Aether
this will look familiar, because the query comes from the same place.
- Open your report in Power BI Desktop
- Go to Optimize and select Performance Analyzer
- Click Start recording, then Refresh visuals
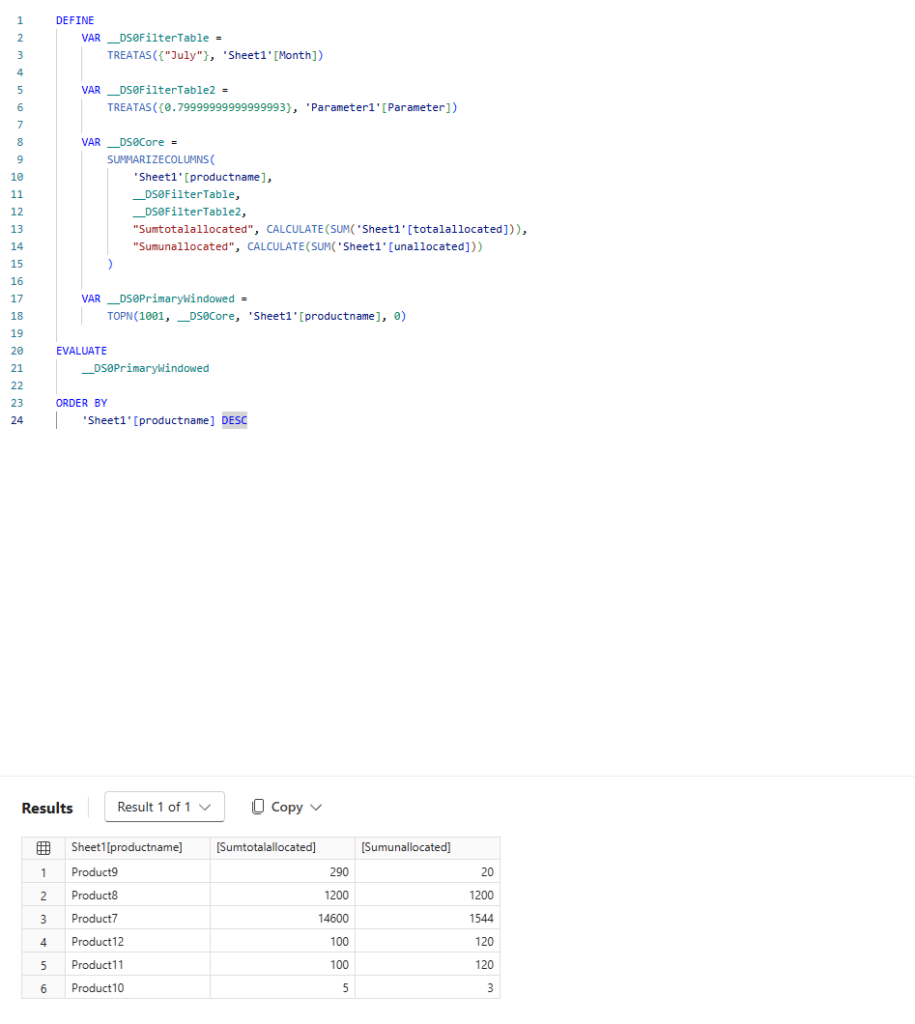
- Find the visual you want and choose Copy query or Run in DAX query view
(I’ve used the same examples from the other post to keep things consistent)
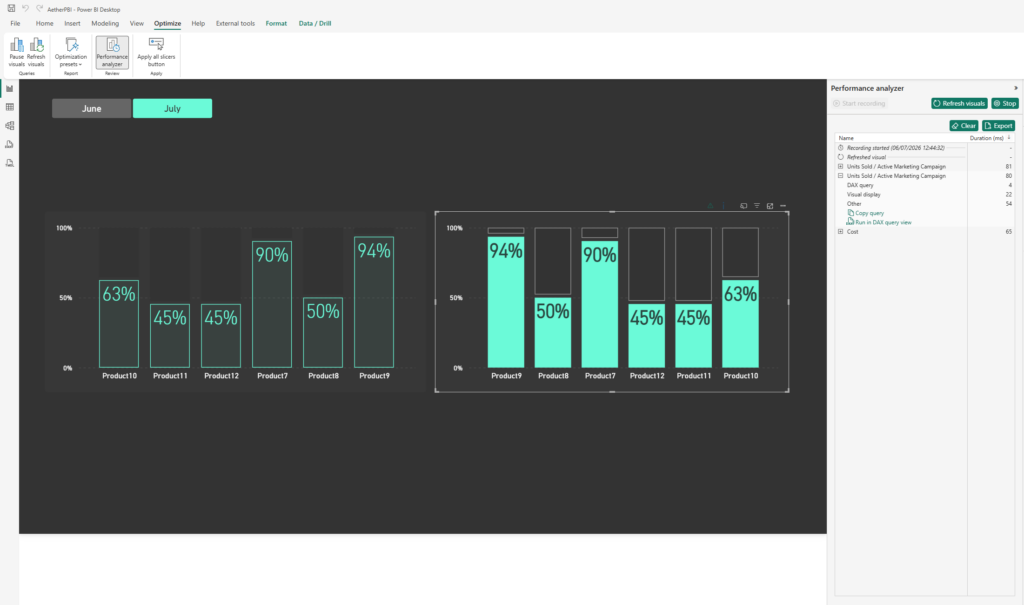
Run it in DAX query view and you’ll see the raw DAX and the output it produces.
Step 2: The script
Here’s the full script. The sections below explain what each part does.
# ============================
# POWERBI Query Runner
# James Mounsey-Moran
# ============================

# Dataset names to include or exclude
# Blank returns all, separate with | for multiple
$include = ""
$exclude = ""

# ============================
# DAX QUERY
# ============================

$daxQueryTemplate = @"
###ADD YOUR QUERY HERE
"@

# ============================
# VARIABLES
# ============================

$successfulDatasets = @()
$failedDatasets = @()

# ============================
# CONNECT TO POWER BI
# ============================

try {
    Connect-PowerBIServiceAccount -ErrorAction Stop
}
catch {
    Write-Error "Failed to connect to Power BI Service: $($_.Exception.Message)"
    return
}

# ============================
# GET WORKSPACES
# ============================

try {

    # To scan all workspaces:
    $workspaces = Get-PowerBIWorkspace -All -ErrorAction Stop
}
catch {
    Write-Error "Failed to retrieve workspaces: $($_.Exception.Message)"
    return
}

# ============================
# PROCESS DATASETS
# ============================

foreach ($workspace in $workspaces) {

    Write-Output ""
    Write-Output "Processing workspace: $($workspace.Name) ($($workspace.Id))"

    try {
        $datasets = Get-PowerBIDataset -WorkspaceId $workspace.Id -ErrorAction Stop |
            Where-Object {
                (-not $include -or $_.Name -match "(?i)$include") -and
                (-not $exclude -or $_.Name -notmatch "(?i)$exclude")
            }
    }
    catch {
        Write-Warning "Failed retrieving datasets from workspace $($workspace.Name)"
        continue
    }

    if (-not $datasets) {
        Write-Output "No datasets found. Skipping."
        continue
    }

    foreach ($dataset in $datasets) {

        Write-Output "  Processing dataset: $($dataset.Name)"

        try {

            $response = Invoke-PowerBIRestMethod `
                -Url "datasets/$($dataset.Id)/executeQueries" `
                -Method Post `
                -Body (@{
                    queries = @(
                        @{
                            query = $daxQueryTemplate
                        }
                    )
                    serializerSettings = @{
                        includeNulls = $true
                    }
                } | ConvertTo-Json -Depth 10) `
                -ErrorAction Stop

            $json = $response | ConvertFrom-Json

            if (-not $json.results) {
                throw "No results returned."
            }


            $rowCount = @($json.results[0].tables[0].rows).Count
            $results = $json.results[0].tables[0].rows

            Write-Output "    SUCCESS ($rowCount rows)"

            $successfulDatasets += [PSCustomObject]@{
                Workspace = $workspace.Name
                Dataset   = $dataset.Name
                Data      = $results
                DatasetId = $dataset.Id
                Rows      = $rowCount
                Timestamp = Get-Date
            }

        }
        catch {

            Write-Output "    FAILED"

            $failedDatasets += [PSCustomObject]@{
                Workspace = $workspace.Name
                Dataset   = $dataset.Name
                DatasetId = $dataset.Id
                Error     = $_.Exception.Message
                Timestamp = Get-Date
            }

        }

    }

}

# ============================
# Results
# ============================

Write-Output ""
Write-Output "============================="
Write-Output "Results"
Write-Output "============================="

Write-Output "Successful datasets: $($successfulDatasets.Count)"
Write-Output "Failed datasets: $($failedDatasets.Count)"

if ($successfulDatasets.Count -gt 0) {


    $successfulDatasets |
        Select-Object Workspace, Dataset |
        Format-Table -AutoSize
}
Connect and find your workspaces
First of all ensure you have the PowerBI modules installed for PowerShell (you may do already)
Install-Module MicrosoftPowerBIMgmtThe script signs in with:
Connect-PowerBIServiceAccountIf that fails, it stops and tells you why.
It then pulls your workspaces with:
Get-PowerBIWorkspace -AllWhich returns every workspace you’re a member of.
Add your query
Paste the query you copied earlier in place of
“###ADD YOUR QUERY HERE”
$daxQueryTemplate = @"
###ADD YOUR QUERY HERE
"@
The closing "@ has to sit at the very start of its own line, or PowerShell will most likely complain.
Target specific models
Set $include and $exclude to limit which models get queried. Leave them blank to hit everything, and separate several names with |. These are regular expressions, so a model name containing characters like ( or . can behave unexpectedly.
This matters more than it looks. If your query references a measure that doesn’t exist in every model, the others will fail, and the filter keeps that noise out.
Run the query
For each workspace, the script lists the models, applies your filters and sends the query to the executeQueries endpoint. Each model that returns data goes into:
$successfulDatasetsAnything that errors goes into $failedDatasets along with the error message, so you can see what went wrong.
Step 3: Look at the results
When the script finishes, you get a summary of how many models succeeded and failed.
The data is held in $successfulDatasets, so you can inspect any model directly. For example, to look at the second one (Yes I know it says 1, the first would be 0):
$successfulDatasets[1]
$successfulDatasets[1].Data
To keep the results, pipe them to a file with Export-CSV if you need to!
What’s next
This is the first step towards something bigger. Once you have a library of queries you trust, you can schedule the script, feed the results into Power Automate, or give them to an AI agent as tools it can call, with answers you can actually rely on.
That’s where I’m heading next.