Tag: powerbi

  • Updating PowerBI reports with Powershell Version 2

    Updating PowerBI reports with Powershell Version 2

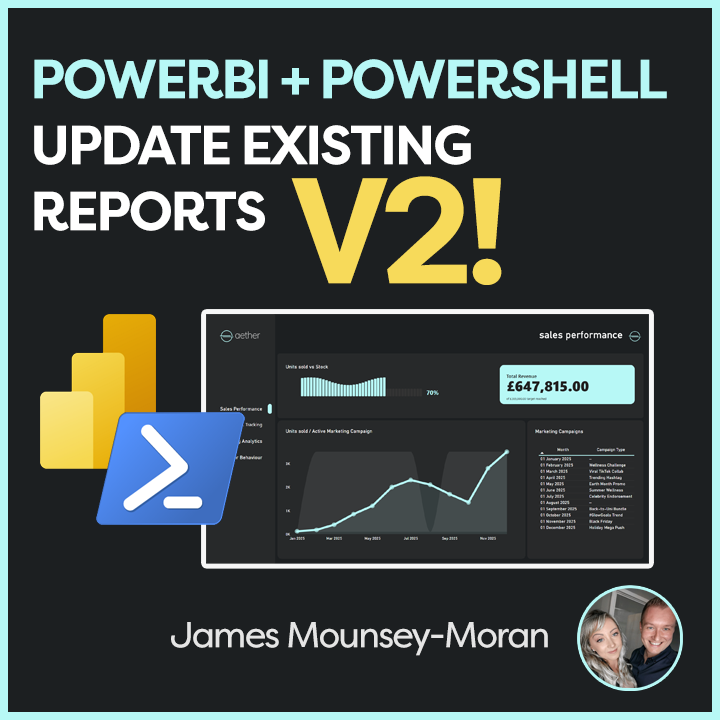
    After a recent update for Prism, I needed to make some changes to my PowerBI update script. This is updating PowerBI reports with Powershell version 2!

    My Powershell scripts have served me well for some time, but after a couple of errors popped up, I found a few extra ways to make it more efficient and also improve how it was handling parameters!

    One thing I noticed was that parameters occasionally failed to load correctly after a PBIX upload. This was due to the upload automatically triggering a dataset refresh, which temporarily blocked the API from accepting new parameter values.

    Turns out this was due to having scheduled refreshes enabled on the existing dataset. The solution, temporarily disable the scheduled refresh!

    So if you have the requirement where you have multiple instances of the same report across the same or different workspaces and need to update them with your latest pbix file this script is for you!

    What the script does?

    This script will pick up a pbix file then scan over your workspaces (based on when filters you apply). When it finds reports that again match your criteria, it will take a copy of the current parameters, temporarily disable the scheduled refresh, update the pbix file and then load the parameters back in. When its finished, it will reenable the scheduled refresh. In some cases I’ve then set it to perform a refresh straight after to load the data back into the report.

    So this means you can upload to the PowerBI service with your pbix file from a single source file, the parameters all remain the same as before, and then we pull in the data based on those parameters and all good to go!

    As part of version control, I currently use a parameter to record the current version of my reports. This adds an extra benefit, as I can then use this script to check if the reports are already on the expected version. Just in case the script is interrupted, or we need to deploy in stages.

    I then add in the new version number as part of the script and this becomes a great way to track report versions when updating PowerBI reports with PowerShell.

    How it works?

    • Connects to Power BI Service using Connect-PowerBIServiceAccount.
    • Retrieves all Power BI workspaces using Get-PowerBIWorkspace.
    • Loops through each workspace and identifies reports whose names start with “AETHER”. (or however best for you)
    • For each report:
    • Retrieves the dataset parameters.
    • Updates the first parameter’s value to a specified version if it doesn’t already match.
    • Disables scheduled refresh
    • Overwrites the report in the workspace using a specified PBIX file ($FilePath).
    • Takes over the dataset to ensure permissions are set correctly.
    • Updates the dataset parameters.
    • Re-enables the scheduled refresh

    Key things you can change

    • $DeployVer: The new deployment version to update the first parameter to (e.g., “2025Q2”).
    • The reports to find matching a name convention e.g. $_.Name -LIKE ‘*AETHER*’
    • $FilePath: The path to the PBIX file used for updating reports.
    • Parameter 0 is assumed to represent a version parameter (e.g., “2025Q2”)
    # Connect to Power BI Service Account
    Connect-PowerBIServiceAccount
    
    # Set the deployment version to be used for updating parameters
    $DeployVer = "2025Q2"
    
    # Define the path to the PBIX file to be used for report updates
    $FilePath = "C:\MYFILEPATH\REPORT.pbix"
    
    # Define the conflict action for updating reports (e.g., Create or Overwrite existing reports)
    $Conflict = "CreateOrOverwrite"
    
    # Retrieve all Power BI workspaces
    $workspaces = Get-PowerBIWorkspace -all
    
    # Loop through each workspace
    foreach ($workspace in $workspaces) {
    
        # Get all reports in the current workspace with names starting with "AETHER" - adjust the filter as needed
        $Reportlist = Get-PowerBIReport -WorkspaceId $workspace.Id | Where-Object -FilterScript {
            $_.Name -LIKE '*AETHER*'
        }
    
        # Check if any reports were found in the workspace
        if ($Reportlist) {
            Write-Host "Workspace: $($workspace.Name)" # Log the workspace name
    
            # Loop through each report in the report list
            foreach ($Report in $Reportlist) {
                Write-Host "  Report: $($Report.Name)" # Log the report name
    
                try {
                    # Retrieve the parameters of the dataset associated with the report
                    $ParametersJsonString = Invoke-PowerBIRestMethod -Url "https://api.powerbi.com/v1.0/myorg/groups/$($workspace.Id)/datasets/$($Report.DatasetId)/parameters" -Method Get
                    $Parameters = (ConvertFrom-Json $ParametersJsonString).value # Convert JSON response to PowerShell object
                } catch {
                    Write-Host "Error retrieving parameters: $($_.Exception.Message)"
                    continue
                }
    
                $JsonBase = @{}
                $JsonString = $null # Initialize JSON string variable
    
                # Initialize an empty array to hold parameter updates
                $UpdateParameterList = New-Object System.Collections.ArrayList
    
                # Loop through each parameter and prepare the update list
                foreach ($Parameter in $Parameters) {
                    $UpdateParameterList.add(@{"name" = $Parameter.name; "newValue" = $Parameter.currentValue})
                }
    
                # Check if there are any parameters to update
                if ($UpdateParameterList.Count -gt 0) {
                    # Get the current value of the Version parameter
                    $currentparam = $UpdateParameterList[0].newValue
    
                    Write-Host "Current Parameter Version Value: $currentparam" # Log the current parameter value
    
                    # Check if the current parameter value matches the deployment version
                    if ($currentparam -ne $DeployVer) {
                        Write-Host "Version does not match. Updating..." # Log the update action
    
                        # Display current parameters
                        $UpdateParameterList.newValue
    
                        # Update the first parameter to the new deployment version
                        $UpdateParameterList[0].newValue = $DeployVer
    
                        # Prepare the JSON payload for updating parameters
                        $JsonBase.Add("updateDetails", $UpdateParameterList)
                        $JsonString = $JsonBase | ConvertTo-Json
    
                        # Define the report name
                        $ReportName = $Report.Name
    
                        # Disable refresh schedule for the dataset
                        $disableRefreshBody = @"
    {
    "value": {"enabled": false}
    }
    "@
    
                        try {
                            Invoke-PowerBIRestMethod -Url "https://api.powerbi.com/v1.0/myorg/groups/$($workspace.Id)/datasets/$($Report.DatasetId)/refreshSchedule" -Method Patch -Body ("$disableRefreshBody")
                            Write-Host "Refresh schedule disabled for dataset: $($Report.DatasetId)"
                        } catch {
                            Write-Host "Failed to disable refresh schedule: $($_.Exception.Message)"
                        }
    
                        try {
                            # Take over the dataset to ensure permissions are set correctly
                            Invoke-PowerBIRestMethod -Url "https://api.powerbi.com/v1.0/myorg/groups/$($workspace.Id)/datasets/$($Report.DatasetId)/Default.TakeOver" -Method Post
                        } catch {
                            Write-Host "Error taking over dataset: $($_.Exception.Message)"
                            continue
                        }
    
                        try {
                            # Update the existing report in the workspace
                            New-PowerBIReport -Path $FilePath -Name $ReportName -WorkspaceId $workspace.Id -ConflictAction $Conflict
                        } catch {
                            Write-Host "Error uploading report: $($_.Exception.Message)"
                            continue
                        }
    
                        try {
                            # Update the parameters of the dataset
                            Start-Sleep 5
                            Invoke-PowerBIRestMethod -Url "https://api.powerbi.com/v1.0/myorg/groups/$($workspace.Id)/datasets/$($Report.DatasetId)/Default.UpdateParameters" -Method Post -Body $JsonString
                        } catch {
                            Write-Host "Error updating parameters: $($_.Exception.Message)"
                            continue
                        }
    
                        # Reenable refresh schedule for the dataset
                        $enableRefreshBody = @"
    {
    "value": {"enabled": true}
    }
    "@
    
                        try {
                            Invoke-PowerBIRestMethod -Url "https://api.powerbi.com/v1.0/myorg/groups/$($workspace.Id)/datasets/$($Report.DatasetId)/refreshSchedule" -Method Patch -Body ("$enableRefreshBody")
                            Write-Host "Refresh schedule Enabled for dataset: $($Report.DatasetId)"
                        } catch {
                            Write-Host "Failed to Enable refresh schedule: $($_.Exception.Message)"
                        }
    
                        Remove-Variable UpdateParameterList, JsonString -ErrorAction SilentlyContinue
                    } else {
                        Write-Host "Version already matches. Skipping update." # Log if no update is needed
                    }
                } else {
                    Write-Host "No parameters found for this dataset." # Log if no parameters are found
                }
            }
        } else {
            Write-Host "No reports found in workspace: $($workspace.Name)" # Log if no reports are found in the workspace
        }
    }
    
    # Log the completion of the script
    Write-Host "Script completed."

    This approach has saved me hours on PBIX deployment.
    If you discover any useful additions or tweaks, feel free to reach out on LinkedIn or by email I’d love to hear how you’ve adapted it.

    Thanks for reading!

    https://github.com/AetherAdv/powerbi_powershell_updatereports

  • Dynamic PowerBI Backgrounds

    Dynamic PowerBI Backgrounds

    If you saw a couple of my posts on LinkedIn you would have seen some of the things I have been doing to mess with SVGs, HTML, animation and in this initial case Pokémon. I wanted to build a way to be able to seamlessly transition from one colour background to another but in a smooth and animated way driven by slicers, and all linked to dax measures. So, this blog post will give you a quick and easy way to achieve Dynamic PowerBI Backgrounds,

    Doing things this way means rather than relying on bookmarks, theme files to switch up colours or implement ideas such as dark mode we can instead add smooth transitions and make changes in a more dynamic way.

    Use SVG, HTML & CSS to enhance PowerBI reports – Home

    Firstly I configured the measure – this is currently linked to a simple table referencing the Background Type but this of course could be any of your values / data sets.

    I have created two sets of colours relating to the selected option to show the two ends of the gradient. This means when we apply the animation we gain a subtle effect (of course you could just use a simple base colour).

    To create a smoother transition between colours I have set all to initially show as a warm white colour, so instead of instantly performing a jarring switch, the screen goes light and slowly moves to the new selected colour. In my code I have also layered a slight vignette to the edges of the image to emphasise the display.

    As part of this code it is also important to select the correct width and height to ensure the effect fills the screen (set the same as your PBI reports or at least the same aspect ratio such as 1920×1080 if using 16:9)

    HTML_Dynamic_Back = 
    VAR selectedOption =
        // Get the selected background option, defaulting to "Light" if none is selected
        SELECTEDVALUE(BackgroundType[BackgroundType], "Light")
    
    VAR gradientStart =
        // Define gradient start colours for each option
        SWITCH(
            TRUE(),
            selectedOption = "Light", "#F2EFE9",  
            selectedOption = "Dark", "#1A1A1A",   
            selectedOption = "Middle", "#A8A8A8", 
            selectedOption = "Red", "#F08030",   
            selectedOption = "Green", "#78C850",  
            selectedOption = "Blue", "#6890F0",   
            selectedOption = "Yellow", "#F8D030", 
            selectedOption = "Orange", "#FFA500", 
            "#6BFAD8"                             
        )
    
    VAR gradientEnd =
        // Define gradient end colours for a lighter variation of each option
        SWITCH(
            TRUE(),
            selectedOption = "Light", "#FFFFFF",  
            selectedOption = "Dark", "#575757",   
            selectedOption = "Middle", "#D8D8D8", 
            selectedOption = "Red", "#FFD6C1",    
            selectedOption = "Green", "#E6FFE6",  
            selectedOption = "Blue", "#E6F5FF", 
            selectedOption = "Yellow", "#FFFFE0", 
            selectedOption = "Orange", "#FFE6CC", 
            "#FFFFFF"                             
        )
    
    VAR warmOffWhite = "#F2EFE9" // A warm off-white base colour
    
    VAR svg =
        // Construct the SVG with animated gradients and vignette effect
        "<svg xmlns='http://www.w3.org/2000/svg' width='1920' height='1080' preserveAspectRatio='none'>" &
        "   <defs>" &
        "       <linearGradient id='bg-gradient' x1='0%' y1='0%' x2='100%' y2='100%'>" &
        "           <stop offset='0%' stop-color='" & warmOffWhite & "'>" &
        "               <animate attributeName='stop-color' values='" & warmOffWhite & ";" & gradientStart & "' dur='4s' begin='0s' fill='freeze' repeatCount='1'/>" &
        "               <animate attributeName='stop-color' values='" & gradientStart & ";" & gradientEnd & ";" & gradientStart & "' dur='6s' begin='4s' repeatCount='indefinite'/>" &
        "           </stop>" &
        "           <stop offset='100%' stop-color='" & warmOffWhite & "'>" &
        "               <animate attributeName='stop-color' values='" & warmOffWhite & ";" & gradientEnd & "' dur='4s' begin='0s' fill='freeze' repeatCount='1'/>" &
        "               <animate attributeName='stop-color' values='" & gradientEnd & ";" & gradientStart & ";" & gradientEnd & "' dur='6s' begin='4s' repeatCount='indefinite'/>" &
        "           </stop>" &
        "           <animate attributeName='x1' values='0%; -20%; 0%; 20%; 0%' dur='15s' repeatCount='indefinite'/>" &
        "           <animate attributeName='y1' values='0%; -20%; 0%; 20%; 0%' dur='15s' repeatCount='indefinite'/>" &
        "           <animate attributeName='x2' values='100%; 120%; 100%; 80%; 100%' dur='15s' repeatCount='indefinite'/>" &
        "           <animate attributeName='y2' values='100%; 120%; 100%; 80%; 100%' dur='15s' repeatCount='indefinite'/>" &
        "       </linearGradient>" &
        "       <radialGradient id='vignette-gradient' cx='50%' cy='50%' r='75%' fx='50%' fy='50%'>" &
        "           <stop offset='0%' stop-color='black' stop-opacity='0'/>" &
        "           <stop offset='60%' stop-color='black' stop-opacity='0'/>" &
        "           <stop offset='80%' stop-color='#575757' stop-opacity='0.02'/>" &
        "           <stop offset='100%' stop-color='#575757' stop-opacity='0.1'/>" &
        "       </radialGradient>" &
        "   </defs>" &
        "   <rect width='1920' height='1080' fill='url(#bg-gradient)'/>" &
        "   <rect width='1920' height='1080' fill='url(#vignette-gradient)'/>" &
        "</svg>"
    
    RETURN
        "data:image/svg+xml;utf8," & svg

    In this step we need to setup the card to be able to apply the measure. As with my other examples I have been using the new card visual.

    Firstly, on the card, apply the measure under the image section.

    • Select Image URL
    • Select the measure
    • Add a column / value to the card to the Data parameter (any is fine we are going to remove this from view)

    Next we need to resize the card to the full size of the window (or at least the area wanting to use) and then disable the values / labels under the Callout values section:

    • Disable Values
    • Disable Label

    Now all padding needs to be removed from the card as well as removing all existing backgrounds / style effects

    Under Visual / Cards:

    • Disable Background
    • Disable Border
    • Change Padding to custom and set all to 0px

    Under Visual / Images

    • Change Space between Image and callout to 0px

    Under General / Effects

    • Disable Background
    • Under General / Properties
    • Set all Padding to 0px

    Now to test – I’ve added a slicer to switch between the different colours in my measure for example

    To get the best effect from the dynamic background I have set a level of transparency to the visuals (if not dynamically changing these colours too)

    Thanks for reading! Please have a play and let me know what cool things you make! Some actual use cases so far: enhancing UI / UX, a way to light mode / dark mode or accessibility options!

  • Use SVG, HTML & CSS to enhance PowerBI reports

    Use SVG, HTML & CSS to enhance PowerBI reports

    HTML, CSS and SVGs are some of the things I know relatively well, Ive always messed around making games, animating or building apps out of various methods. In this case I wanted to understand how I can use SVG, HTML & CSS to enhance PowerBI reports.

    PowerBI whilst it has a lot of options in terms of its custom visuals, that same flexibility isnt always there. Difference is now you can use SVGs & HTML in tables, cards and all sorts just the same as if you were coding in a webpage. A lot of amazing content creators have already covered a lot of use cases for using HTML & SVG in things like tables. I wanted to do something a bit different, taking a look at those more traditional HTML methods I know for adding things like animation.

    What I have built out as part of this blog post can then be used as a base for building out pretty much anything when it comes to using SVGs and HTML. Throw in animation, changing colors anything you can think of.

    I love that these things also feed into my role as a Product Manager. I can dabble, play and find new ways to make UI / UX more exciting and engaging for my customers.

    Setting up the SVG / HTML Measure

    Firstly, for these initial cases I am just using the built in PowerBI visuals. To make this work we have to load the SVG / HTML in via a measure.

    I have created two base measures to cover common scenarios, depending on your needs (note we can not use JavaScript in either with PowerBI)

    • Using <foreignObject> to embed extended HTML and CSS inside SVG
    • Using pure SVG native elements

    FeatureSVG Native<foreignObject> (Extended HTML inside SVG)
    CSS SupportLimited to SVG and subset of CSSFull CSS including advanced layout, pseudo-elements
    Browser & tool supportVery broad, stableGood in modern browsers, less consistent in tools like Power BI
    Use casesSimple vector graphics, text, shapesComplex layouts, rich text formatting inside SVG
    PerformanceLightweight, fastSlightly heavier, potentially slower
    InteractivitySVG events and styling onlyCan use HTML events and richer interaction

    <foreignObject> Base

    HTMLBASE_FO = 
    
    -- Get the percentage value from a slicer or parameter table (assumes 0 to 1 scale)
    VAR pct = Parameter1[Parameter Value]
    
    -- Format the percentage as a whole number string with a "%" sign (e.g., "85%")
    VAR pctText = FORMAT(pct * 100, "0") & "%"
    
    -- Define the size of the SVG image
    VAR sizeWidth = 320
    VAR sizeHeight = 180
    
    -- Define dynamic colours
    VAR baseColor = "#292929"
    VAR textColor = "#f5f5f5"
    VAR subtitleColor = "#bbb"
    
    -- Build the HTML block for the foreignObject
    VAR svghtml = "
    <foreignObject x='0' y='0' width='" & sizeWidth & "' height='" & sizeHeight & "'>
      <div xmlns='http://www.w3.org/1999/xhtml'>
        <style>
          .card {
            width: 100%;
            height: 100%;
            background-color: " & baseColor & ";
            border-radius: 20px;
            padding: 24px;
            box-sizing: border-box;
            font-family: Segoe UI, sans-serif;
            display: flex;
            flex-direction: column;
            justify-content: center;
          }
          .title {
            font-size: 22px;
            font-weight: 600;
            color: " & textColor & ";
          }
          .value {
            font-size: 64px;
            font-weight: 900;
            color: " & textColor & ";
            margin-top: 4px;
          }
          .subtitle {
            font-size: 14px;
            color: " & subtitleColor & ";
            margin-top: auto;
          }
        </style>
        <div class='card'>
          <div class='title'>Title</div>
          <div class='value'>" & pctText & "</div>
          <div class='subtitle'>SubTitle</div>
        </div>
      </div>
    </foreignObject>
    "
    
    -- Wrap the foreignObject in an SVG
    VAR svg = "<svg xmlns='http://www.w3.org/2000/svg' width='" & sizeWidth & "' height='" & sizeHeight & "'>" & svghtml & "</svg>"
    
    -- Return the inline image
    RETURN "data:image/svg+xml;utf8," & svg

    SVG Native Base

    HTMLBASE_SVG = 
    VAR pct = Parameter1[Parameter Value]
    VAR pctText = FORMAT(pct * 100, "0") & "%"
    VAR sizeWidth = 320
    VAR sizeHeight = 180
    
    VAR baseColor = "#292929"
    VAR textColor = "#f5f5f5"
    VAR subtitleColor = "#bbb"
    
    VAR fillColor =
        SWITCH(
            TRUE(),
            pct < 0.2, "#E59EFB",
            pct > 0.8, "#F8FAB7",
            "#6bfad8"
        )
    
    
    -- SVG generation
    VAR svg = "
    <svg xmlns='http://www.w3.org/2000/svg' width='" & sizeWidth & "' height='" & sizeHeight & "' viewBox='0 0 " & sizeWidth & " " & sizeHeight & "'>
      <style>
        .card-base {
          fill: " & baseColor & ";
        }
        .title {
          font-family: Segoe UI, sans-serif;
          font-size: 22px;
          font-weight: 600;
          fill: " & textColor & ";
        }
        .value {
          font-family: Segoe UI, sans-serif;
          font-size: 64px;
          font-weight: 900;
          fill: " & textColor & ";
        }
        .subtitle {
          font-family: Segoe UI, sans-serif;
          font-size: 14px;
          fill: " & subtitleColor & ";
        }
      </style>
    
      <!-- Background -->
      <rect class='card-base' width='" & sizeWidth & "' height='" & sizeHeight & "' rx='20' ry='20'/>
    
      <!-- Text -->
      <text x='30' y='60' class='title'>Title</text>
      <text x='30' y='120' class='value'>" & pctText & "</text>
      <text x='30' y='160' class='subtitle'>SubTitle</text>
    
    </svg>
    "
    
    RETURN "data:image/svg+xml;utf8," & svg
    

    Adding the SVG / HTML Measure into a Card

    Next, to use this measure I have been using it in the new card visual. Drop a card onto your dashboard – for the case of this code you will need to put any value into the Data field and then disable the callout value / label.

    Once added open the “Images” section on the card settings. Change the Image type to “Image URL” and select your new measure.

    Use SVG, HTML & CSS to enhance PowerBI reports

    Modifying for your own use case

    Once you have this in place you should end up with something like this

    Now you change them around, build anything as long you keep the main building blocks of the code for SVG rendering.

    Eventually you can end up with all sorts of cool things such as the below. These are then all animated with various methods.

    Use SVG, HTML & CSS to enhance PowerBI reports

    A further example

    This code for example animated the bar in the top right with a wave effect

    HTML_Wave_Bar = 
    
    VAR pct = Parameter1[Parameter Value]
    VAR pctText = FORMAT(pct * 100, "0") & "%"
    
    VAR numBars = 40                        -- Added: number of bars for progress
    VAR barsToFill = ROUND(pct * numBars, 0)   -- Added: how many bars to fill based on pct
    
    
    VAR fillColor =                          -- Added: conditional bar color based on pct
        SWITCH(
            TRUE(),
            pct < 0.2, "#E59EFB",
            pct > 0.8, "#F8FAB7",
            "#6bfad8"
        )
    
    -- Added: Generate multiple bar divs with animation and staggered delay
    VAR barHTML = 
    CONCATENATEX (
        GENERATESERIES(1, numBars, 1),
        VAR i = [Value]
        VAR isFilled = i <= barsToFill
        VAR barColor = IF(isFilled, fillColor, "#333")
        VAR height = IF(isFilled, "100%", "40%")
        VAR animation = IF(isFilled, "waveBar 2.5s ease-in-out infinite", "none")
        VAR delay = FORMAT((i - 1) * 0.10, "0.00") & "s"
        VAR animationDelay = IF(isFilled, delay, "0s")
        RETURN "
            <div class='bar' style='
                background: " & barColor & ";
                height: " & height & ";
                animation: " & animation & ";
                animation-delay: " & animationDelay & ";
            '></div>"
    )
    
    -- Dimensions increased for full bar display (added larger SVG size)
    VAR sizeWidth = 1280
    VAR sizeHeight = 200
    
    -- Added: Style definitions including animation keyframes for bars and fade-in for label
    VAR svghtml = "
    <foreignObject x='0' y='0' width='" & sizeWidth & "' height='" & sizeHeight & "'>
    <div xmlns='http://www.w3.org/1999/xhtml'>
      <style>
        .container {
          font-family: Segoe UI, sans-serif;
          width: 90%;
          height: 150px;
          margin: auto;
          display: flex;                     
          align-items: flex-end;
          justify-content: flex-start;
          gap: 4px;                          
        }
        .bar {
          width: 20px;
          border-radius: 4px;
          transition: height 0.3s ease;      
        }
        .percentage-label {
          font-size: 48px;
          font-weight: bold;
          color: " & fillColor & ";          
          text-shadow: 0 0 6px rgba(0,0,0,0.3);
          margin-left: 30px;
          align-self: flex-end;
          animation: fadeIn 0.5s ease-in;   
        }
        @keyframes waveBar {               
          0%, 100% { height: 60%; }
          50% { height: 100%; }
        }
        @keyframes fadeIn {                 
          from { opacity: 0; transform: translateX(-10px); }
          to { opacity: 1; transform: translateX(0); }
        }
      </style>
      <div class='container'>
        " & barHTML & "                   
        <div class='percentage-label'>" & pctText & "</div>  
      </div>
    </div>
    </foreignObject>
    "
    
    -- Wrap in SVG and return as image (same concept, but bigger canvas for wave bars)
    VAR svg = "<svg xmlns='http://www.w3.org/2000/svg' width='" & sizeWidth & "' height='" & sizeHeight & "'>" & svghtml & "</svg>"
    
    RETURN "data:image/svg+xml;utf8," & svg

    Aether Repository – Use SVG, HTML & CSS to enhance PowerBI reports

    I have added these base sets of code to my Aether repo. So feel free to grab, comment and play. As I create some new animations and visuals, I will look to upload those as well

    https://github.com/AetherAdv/dax_htmlbase_FO

    https://github.com/AetherAdv/dax_htmlbase_SVG